Trump Shares Chart Ranking His Terms Lowest on Cumulative Inflation
Trump amplifies a Truth Social post placing his second term at 4.71% cumulative inflation, the lowest among 10 presidential terms, using Bureau of Labor Statistics CPI-U data.

WASHINGTON D.C. — Donald J. Trump amplified a chart ranking his two terms lowest on cumulative inflation among the last 10 presidential terms, using federal price data.
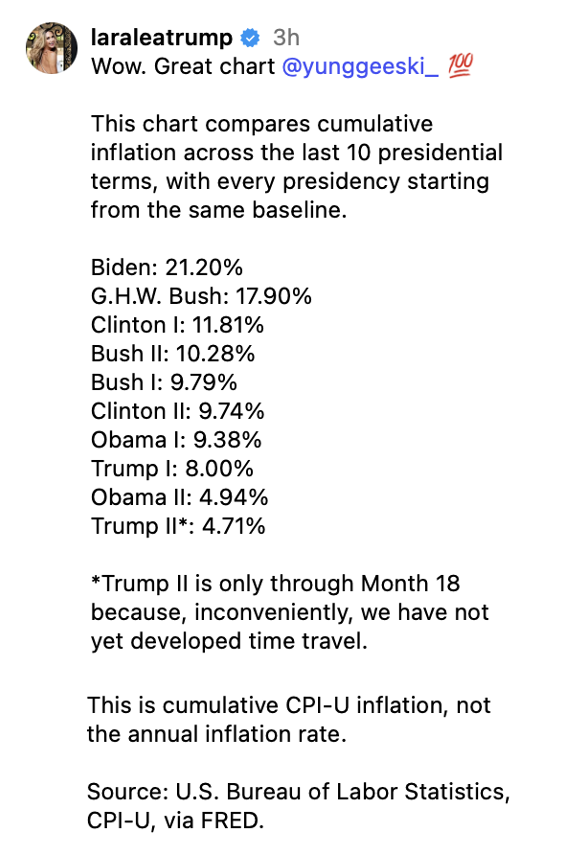
The chart, drawn from the U.S. Bureau of Labor Statistics CPI-U series, placed the Biden administration highest at 21.20% cumulative inflation and Trump’s second term lowest at 4.71%, measured against a common baseline for each presidency. The figures compared cumulative price growth rather than annual inflation rates. The second-term number carried a caveat that it reflected only 18 months of data rather than a full four-year term.
Here is the full post on truthsocial: “laraleatrump 3h Wow. Great chart @yunggeeski_100 This chart compares cumulative inflation across the last 10 presidential terms, with every presidency starting from the same baseline. Biden: 21.20% G.H.W. Bush: 17.90% Clinton I: 11.81% Bush II: 10.28% Bush I: 9.79% Clinton II: 9.74% Obama I: 9.38% Trump I: 8.00% Obama II: 4.94% Trump II*: 4.71% *Trump II is only through Month 18 because, inconveniently, we have not yet developed time travel. This is cumulative CPI-U inflation, not the annual inflation rate. Source:U.S. Bureau of Labor Statistics, CPI-U, via FRED.” on August 9, 2026 at 4:19 PM ET.
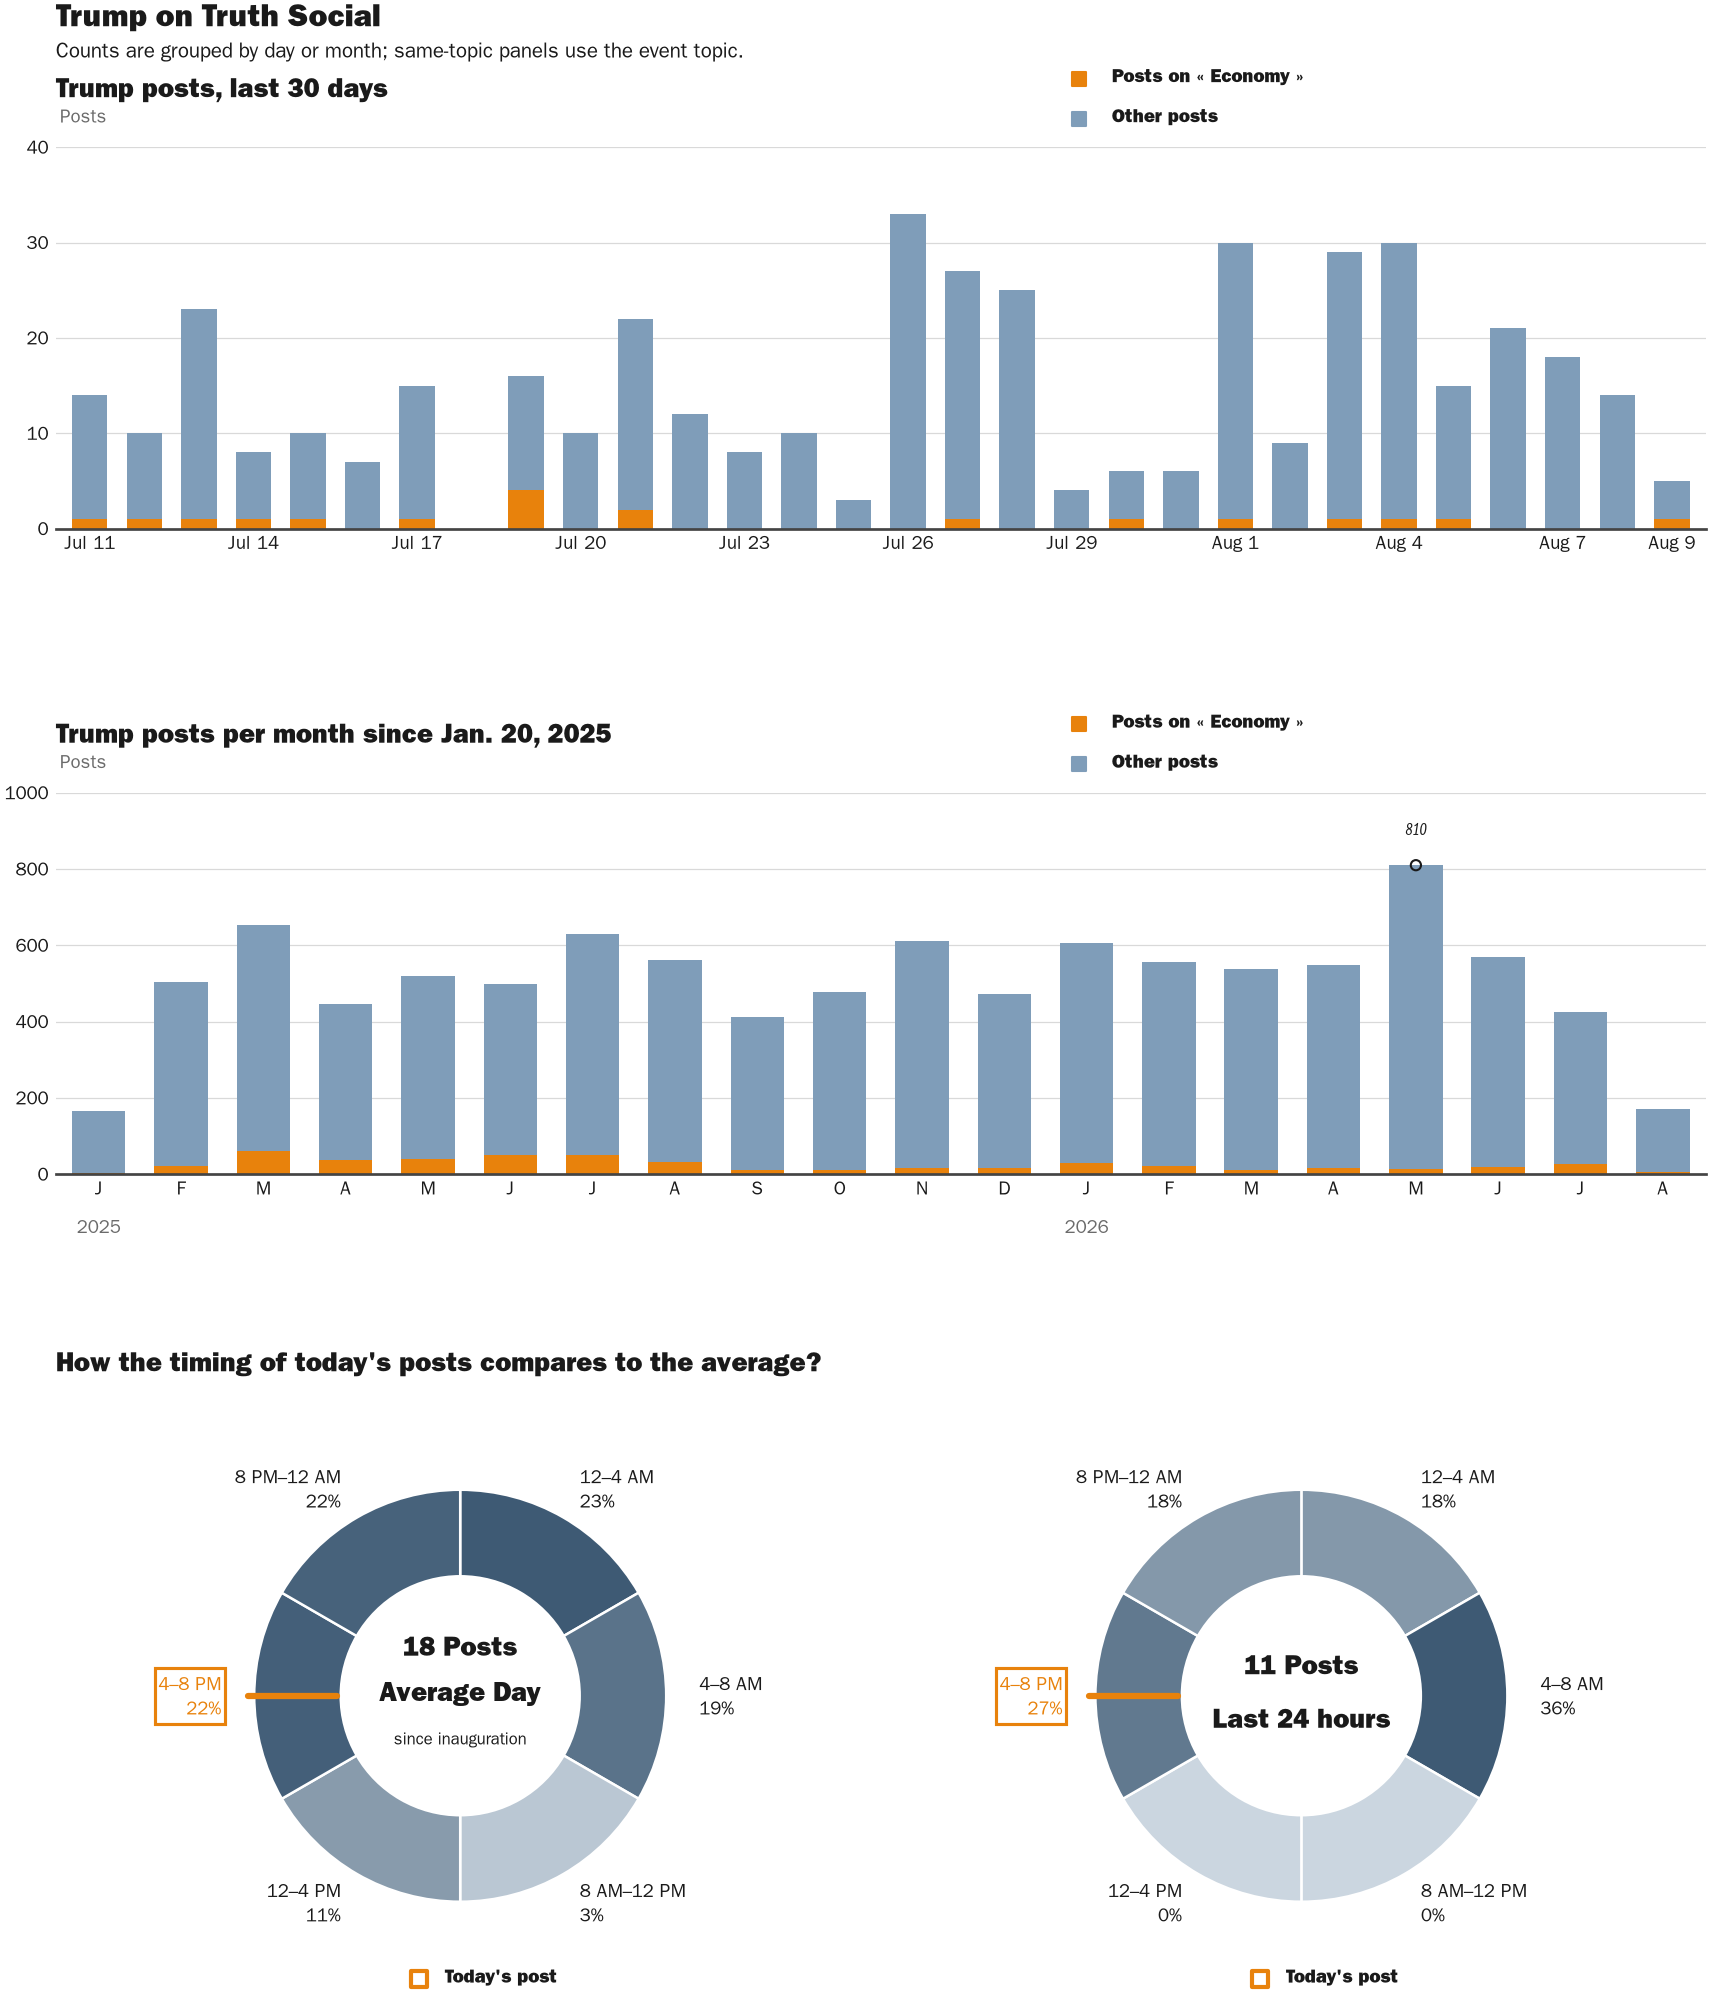
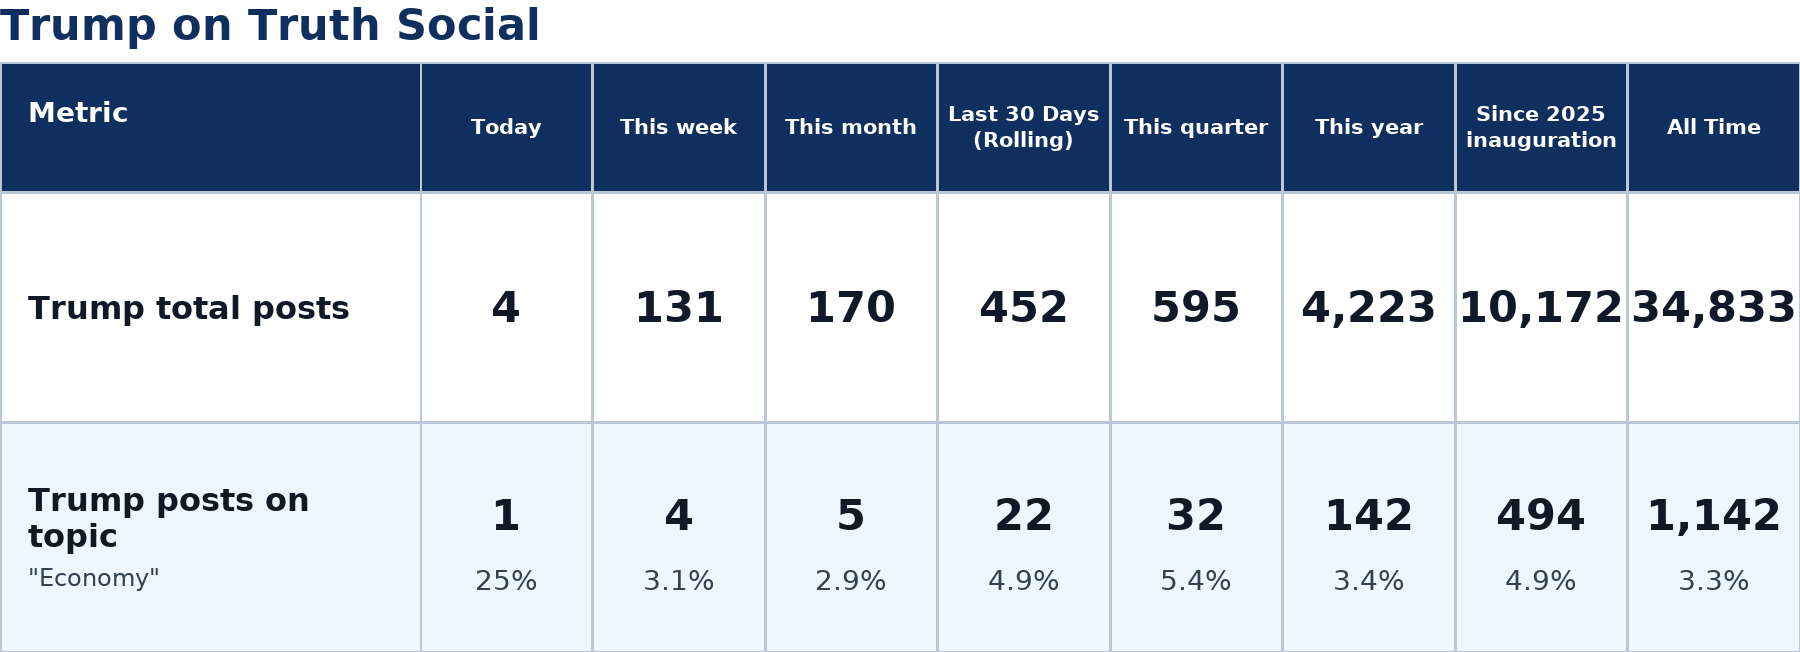
This is Trump’s 4th message released today, and the last post was 3 hours ago, and it is not part of a thread. On average, Trump produces 18 posts per day since his inauguration on January 20, 2025. The move fits a broader pattern in Trump’s recent messaging, with 22 of his 452 posts over the last 30 days classified as Economy posts.
The chart ranked the 10 terms by how much Consumer Price s rose over each period, with every presidency starting from the same index level. Behind Biden at 21.20% came the term of George H.W. Bush at 17.90%, followed by Bill Clinton’s first term at 11.81% and George W. Bush’s second term at 10.28%. Trump’s first term registered 8.00%, while Barack Obama’s second term came in at 4.94% and Trump’s current term at 4.71%.
The post’s framing carries stakes for how voters read the economy heading into the political calendar. A ranking that places Trump’s terms at the bottom of the inflation list benefits the administration’s economic message. It also invites scrutiny from critics who note the second-term figure covers a shorter window than the completed terms above it.

President Donald J. Trump shared a chart on social media at Washington D.C.
© copyright Zenger.News
The comparison relies on cumulative CPI-U inflation, a measure the Bureau of Labor Statistics tracks monthly as the change in prices paid by urban consumers. Cumulative inflation stacks each month’s price change on top of the last, so longer terms accumulate more even at similar annual rates. The post acknowledged that limitation for the 18-month second-term figure.
For the average reader, the numbers translate into the pace at which grocery, housing and gasoline prices climbed across each administration. A lower cumulative figure means prices rose less over the period measured. The annual rate a household feels month to month can differ from the stacked total shown in the chart.
Inflation comparisons across presidencies have surfaced in political messaging before. Both parties have used Bureau of Labor Statistics price data to argue their record, and the choice of cumulative versus annual measures shapes which president appears strongest, as the post itself flagged with its footnotes.
The next signal on the price picture will come from the Bureau of Labor Statistics, which publishes its Consumer Price Index on a monthly schedule. A specific date for the administration’s next economic messaging on the issue has not been announced.
Presidents leaning on inflation numbers to shape public opinion is a long-running feature of American economic politics. Gerald Ford launched his “Whip Inflation Now” campaign in October 1974 as Consumer Price s climbed above 12%, distributing buttons and urging households to curb spending. The effort became a symbol of a fight the White House struggled to win, and Ford lost the 1976 election as economic anxiety persisted.
NewsFindr Chart Maker
Photo by Zenger real-time database of all Truth Social posts.
Zenger analysis
Photo by Zenger analysis